The online timeline maker
* Free Premium for social media mentions.

American Association of School Librarians
In 2018, Time.Graphics was recognized as one of the best websites for teaching and learning.
Built for education
Time.Graphics helps schools, colleges, and universities bring learning to life. Manage teachers, students, classrooms, and subscriptions — all from a single dashboard.
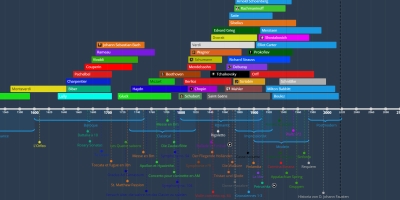
Visualize historical events, processes, and their connections on an interactive timeline. Compare, analyze, and discover cause-and-effect relationships across any period of history. A powerful research tool for understanding the development of civilizations, nations, and ideas.

Get a dedicated dashboard to manage accounts, classrooms, and subscriptions — with educational discounts of up to 90%.
For educational institutions

Collaborate with students, assign homework, and track progress — all in one place.
For teachers

Use timelines to organize study materials, plan projects, and prepare for exams.
For students
Editor's choice
User Interface
Take a few minutes to explore the editor's features.


Download & Print
Create a timeline in minutes and export it in a variety of formats.
Integrated with Google Services
Import events from Google Calendar, pinpoint locations with Google Maps, embed YouTube videos, bulk-upload events from Google Sheets, and connect Google Analytics.


Complete export for offline viewing
View your timeline offline. Export everything to Google Drive, Dropbox, or download it to your computer or phone as a ZIP archive.
Other Big Data
Embed Vimeo videos, visualize World Bank data by country, collaborate on timelines in real time, connect your own data sources, and more.